Overview
First impressions are everything in dating apps, and performance plays a major role. Tinder’s Discovery screen is the core of the app experience, where users expect to swipe through profiles instantly. Any delays, big or small, can break that momentum and impact user satisfaction.
Using Product Science’s lightweight instrumentation, our slighter method of analyzing app performance, we captured traces from Tinder’s Android app to assess real-world user experience. Without any involvement from Tinder’s team, PS Tool was able to surface significant insights pointing to almost 3 s of avoidable latency during app start and first-image rendering. These optimization opportunities were easily identified using the synchronized video panel and highlighted execution path, both unique to PS Tool.
These findings outlined below highlight how even market-leading apps can experience silent performance regressions and how PS Tool can detect them with minimal overhead.
Finding #1: App Start Delays Due to Deferred API Requests
When a user opens Tinder, they expect content to appear quickly. But PS Tool revealed that the app’s request to load potential matches wasn’t initiated right away. Instead, it waited until multiple UI elements had already inflated, costing valuable time.
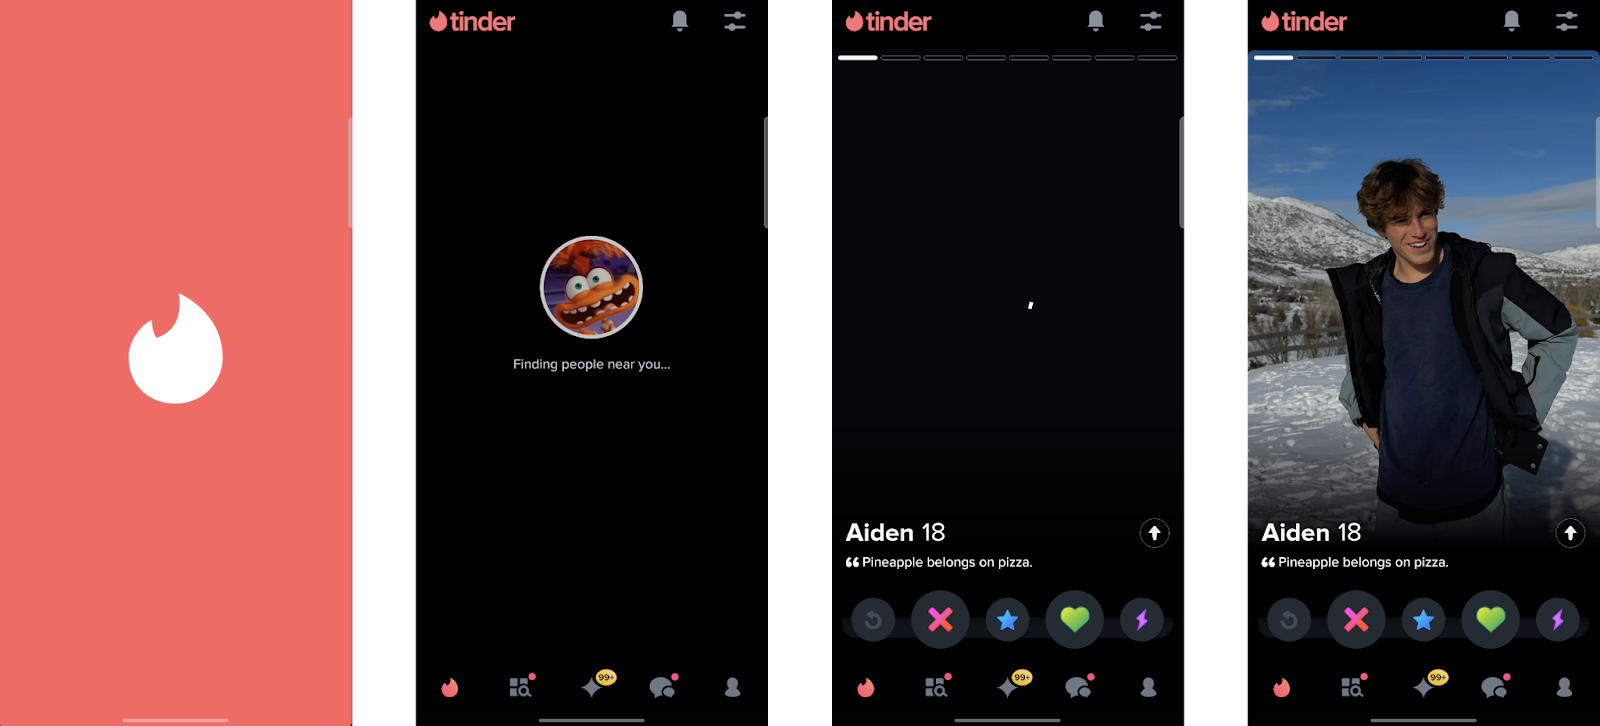
Imagine you spend valuable time curating the perfect frame and setting for a photo, but when it comes time to place the image in the frame, it is not finished and the frame must remain empty until it is. Meanwhile, the empty frame serves as a reminder that something is missing. This is similar to what a user experiences while waiting for profile images to load when all other aspects of the UI are visible and fully loaded.
Rather than kicking off the profile-fetching request at the earliest possible moment (such as in TinderApplication.onCreate()), it was launched from a doFrame callback after layout inflation, around 575 ms after app launch.
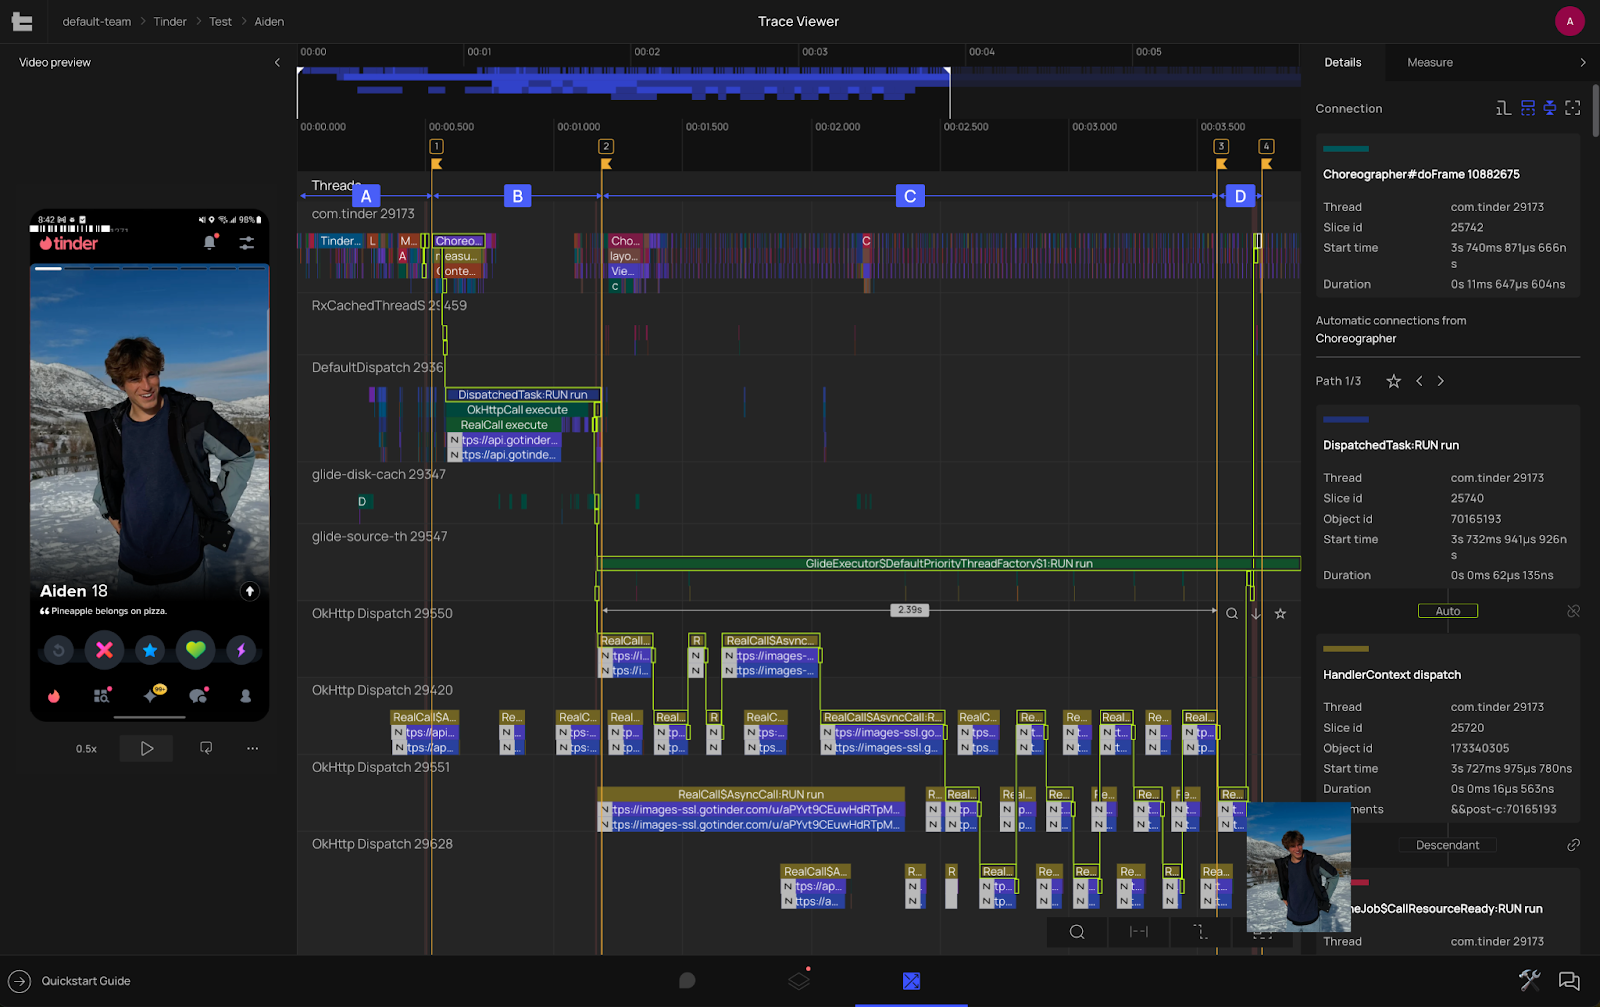
Pic 2 is a screenshot from PS Tool showing a frame-by-frame view of what’s happening with both the app’s UI and the codebase. 1.2 s after app launch, Aiden’s profile layout is visible, but the photo is still missing. The screenshot below is taken from a trace file opened in PS Tool, which precisely synchronizes the video of the UI with the performance trace, accurate to a single frame.
The trace shows when the network request fetching the profile data was made and what caused the delay loading the profile image. PS Tool highlights the full execution path, or the chain of processes kicked off within the app before the network request is triggered. In this case, the request is waiting to be triggered by a UI update rather than being fetched ahead of time, which would have been optimal for performance.
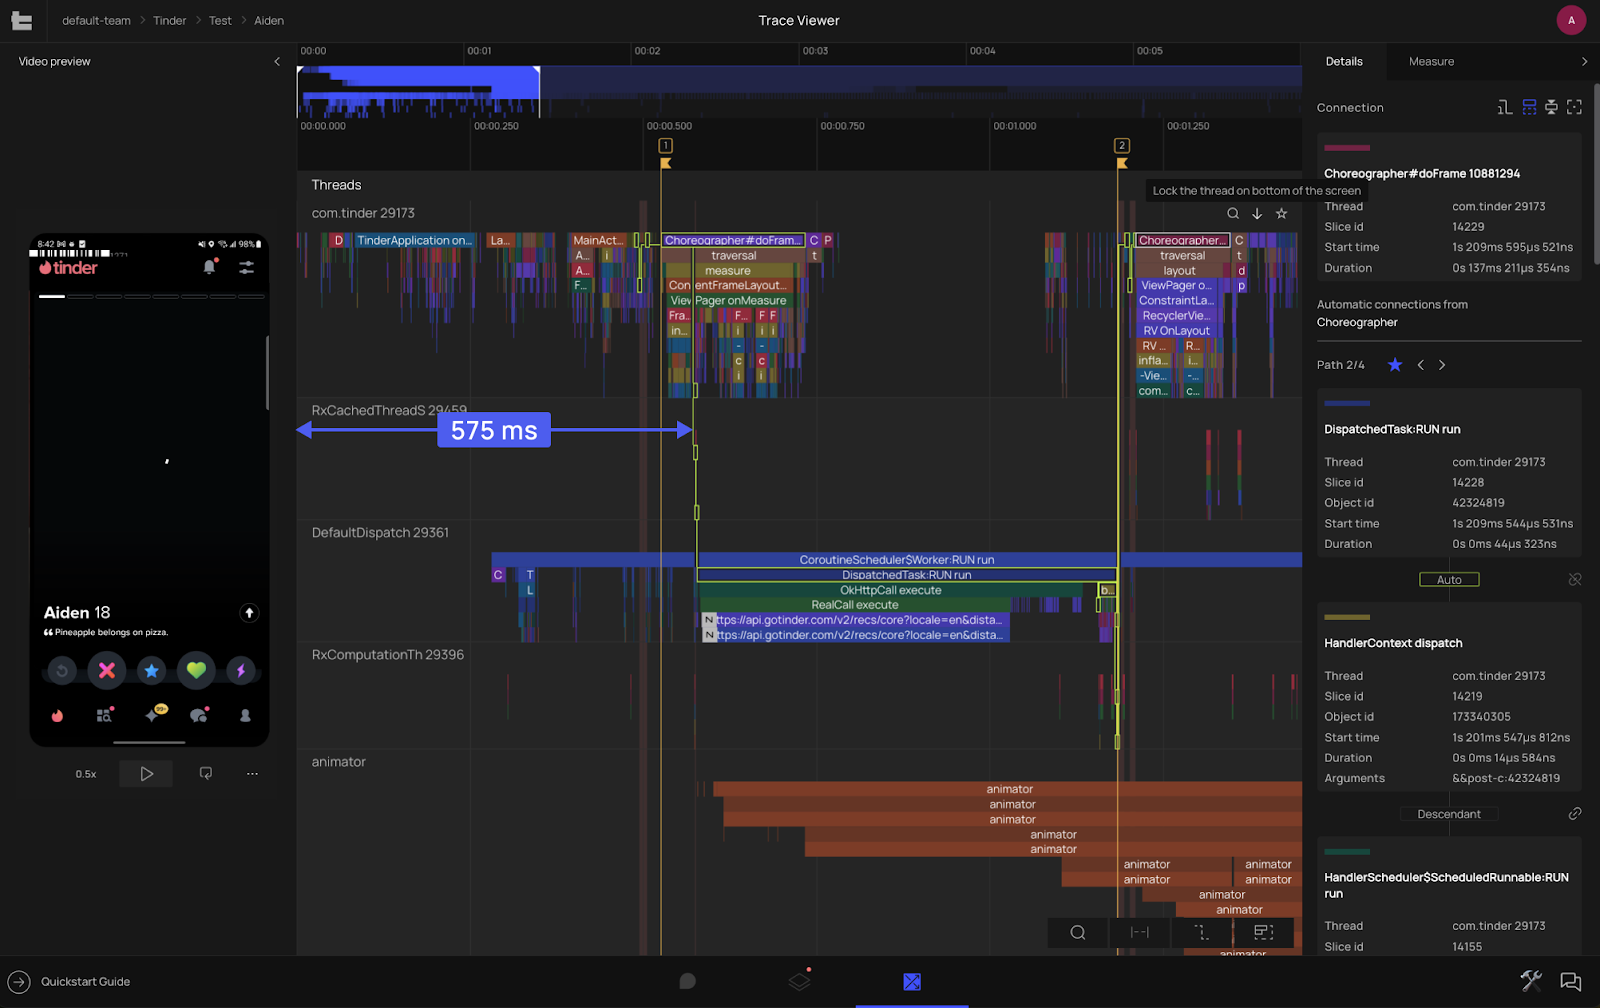
Scheduling the request from TinderApplication.onCreate()could allow the Discovery screen to appear up to 430 ms faster. Earlier execution would result in users seeing the main content much quicker, improving perceived responsiveness, and reducing the likelihood that a user will abandon their session due to major loading delays loading user profiles after app launch.
Finding #2: First Profile Image Appears Late or Not at All
While the Discovery screen layout often appeared quickly, the first profile image was frequently delayed. However, when the image is displayed on the screen efficiently, it takes less than 250 ms to load, decode and show the image after the initial request with profiles’ data is completed.
Pic 3 from PS Tool shows that the image request was triggered but delayed due to the network request taking several seconds. Pic 4 shows where a fallback request to fetch that same image was triggered but experienced a 2.4 second delay due to waiting in the image loading queue.
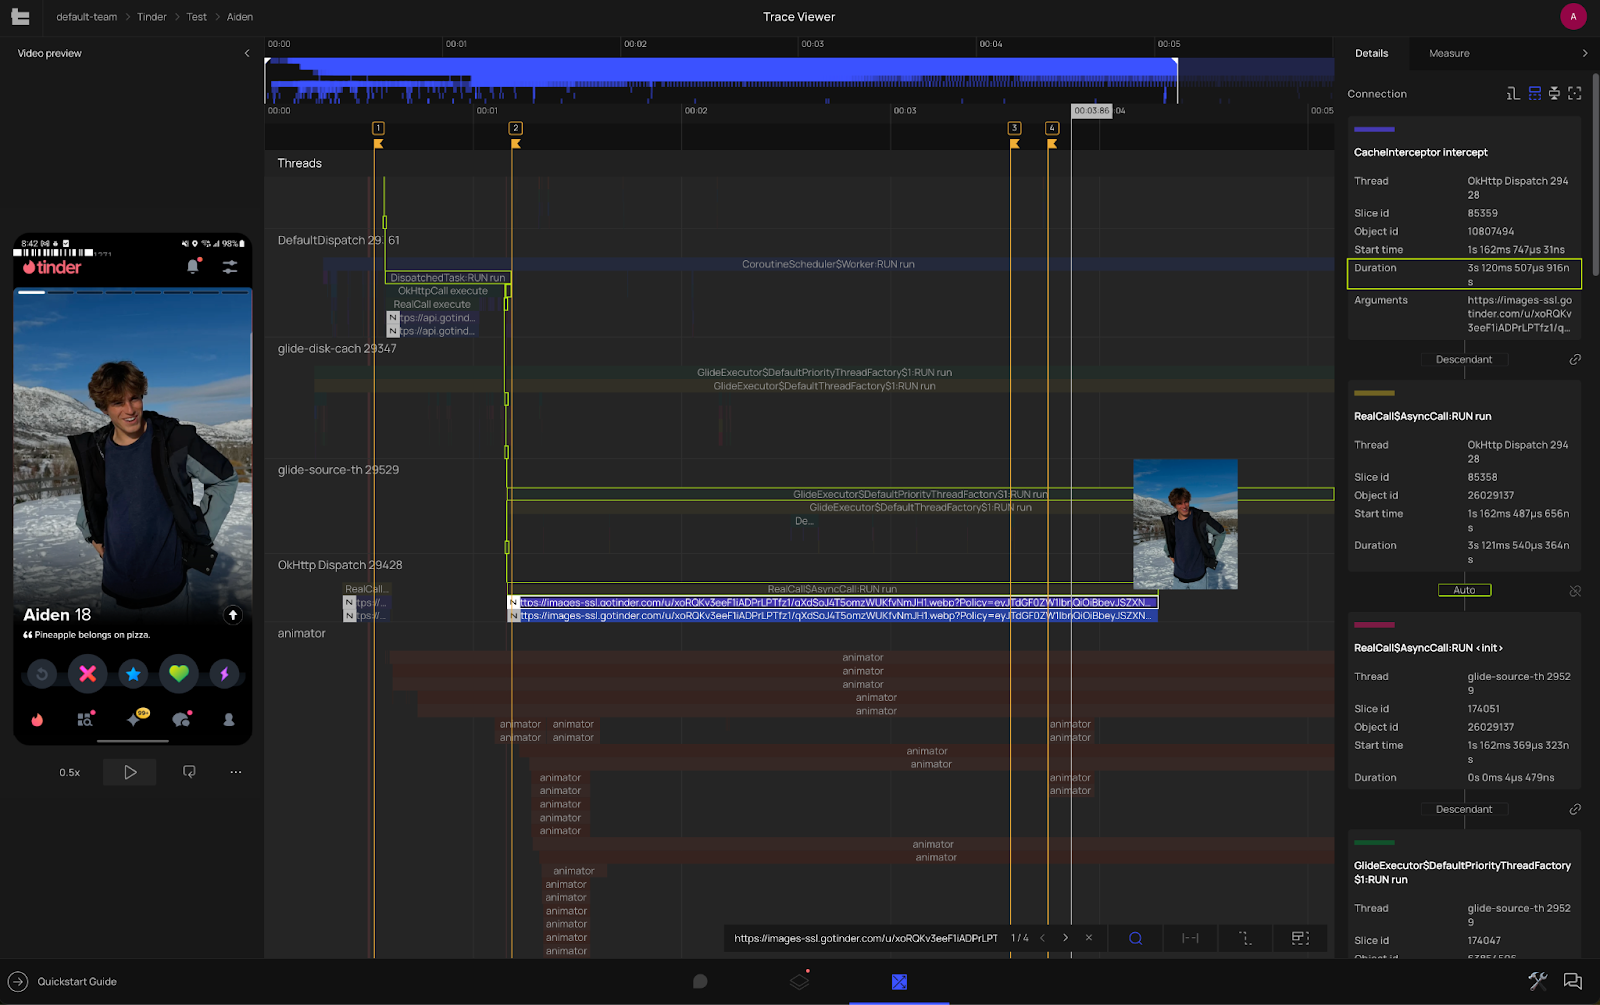
These issues were likely caused by Okhttp queue overloads and unnecessary dependencies on UI updates, not uncommon in feed-heavy apps, but still critical to address.
Why These Findings Matter
Performance issues like these can significantly impact engagement on dating apps. Multiple studies, including our own client experiments, show that reducing delays as small as 100 ms can noticeably improve user engagement, let alone reducing avoidable delays lasting several seconds. Such delays, especially before the first swipe or profile image loads, could lead users to abandon their session early.
Tinder’s case demonstrates that:
- User-perceived performance is shaped by what appears on screen, not just backend speed.
- Early triggers and smarter scheduling can significantly reduce latency.
- Tools like PS Tool can uncover these issues quickly, without slowing down development.
Conclusion
Using lightweight instrumentation, PS Tool surfaced meaningful latency insights on Tinder’s Discovery screen without requiring SDKs, engineering work, or any involvement from Tinder’s team. These results demonstrate the value of a performance audit that captures real-world delays users experience.
It is important to note that all of these insights were discovered independently using PS Tool’s distinct features, without needing access to Tinder’s internal systems or full instrumentation.
While analysis with lightweight instrumentation can reveal critical performance gaps, our full integration provides much deeper visibility. With complete instrumentation, teams can access more granular insights, uncover additional root causes, and unlock a wider range of optimization opportunities that would otherwise go unnoticed.
If your team is focused on delivering faster, smoother app experiences, PS Tool can help identify the bottlenecks that matter most.
Learn more at productscience.ai