InDrive worked with Product Science and PS Tool to take a closer look at the performance of their Android app. Over the course of eight weeks, inDrive with the help of Product Science, conducted detailed analyses on seven key user flows. PS Tool allowed them to capture trace-level data, identify patterns of inefficiency, and uncover 18 concrete opportunities to reduce latency. The tool also flagged two unexpected behaviors that signaling potential bugs. Altogether, 4.5 seconds of latency savings were revealed across flows that are central to the inDrive app experience.
These findings offered inDrive a clear roadmap for improving app speed and responsiveness, without requiring deep architectural changes. This engagement demonstrated how small changes in request timing, sequence execution, and UI preparation—all identified using PS Tool, can add up to significant gains in user experience.
The Setup: What Indrive Analyzed
Indrive analyzed flows where performance delays would most directly affect the user experience. These included high-frequency interactions, cold app starts, and flows critical to both driver earnings and rider satisfaction.
Driver flows:
- My Income
- Ride History
- Ride Details
- Ride Request Notification (cold start)
Passenger flows:
- Accept Ride
- Cold App Start to Cargo
Cold App Start to City to City
These flows were chosen because they consistently influence first impressions, ride acceptance, and the perception of speed within the app. By targeting these specific interactions, optimization opportunities would offer maximum impact with minimal disruption.
What PS Tool Revealed
PS Tool provided full visibility into network behavior, rendering sequences, UI preparation timing, and the dependencies between the methods executing during each flow. Indrive used PS Tool to analyze traces with synchronized UI recordings to highlight areas where performance could be tightened.
Cold Starts with Room to Improve
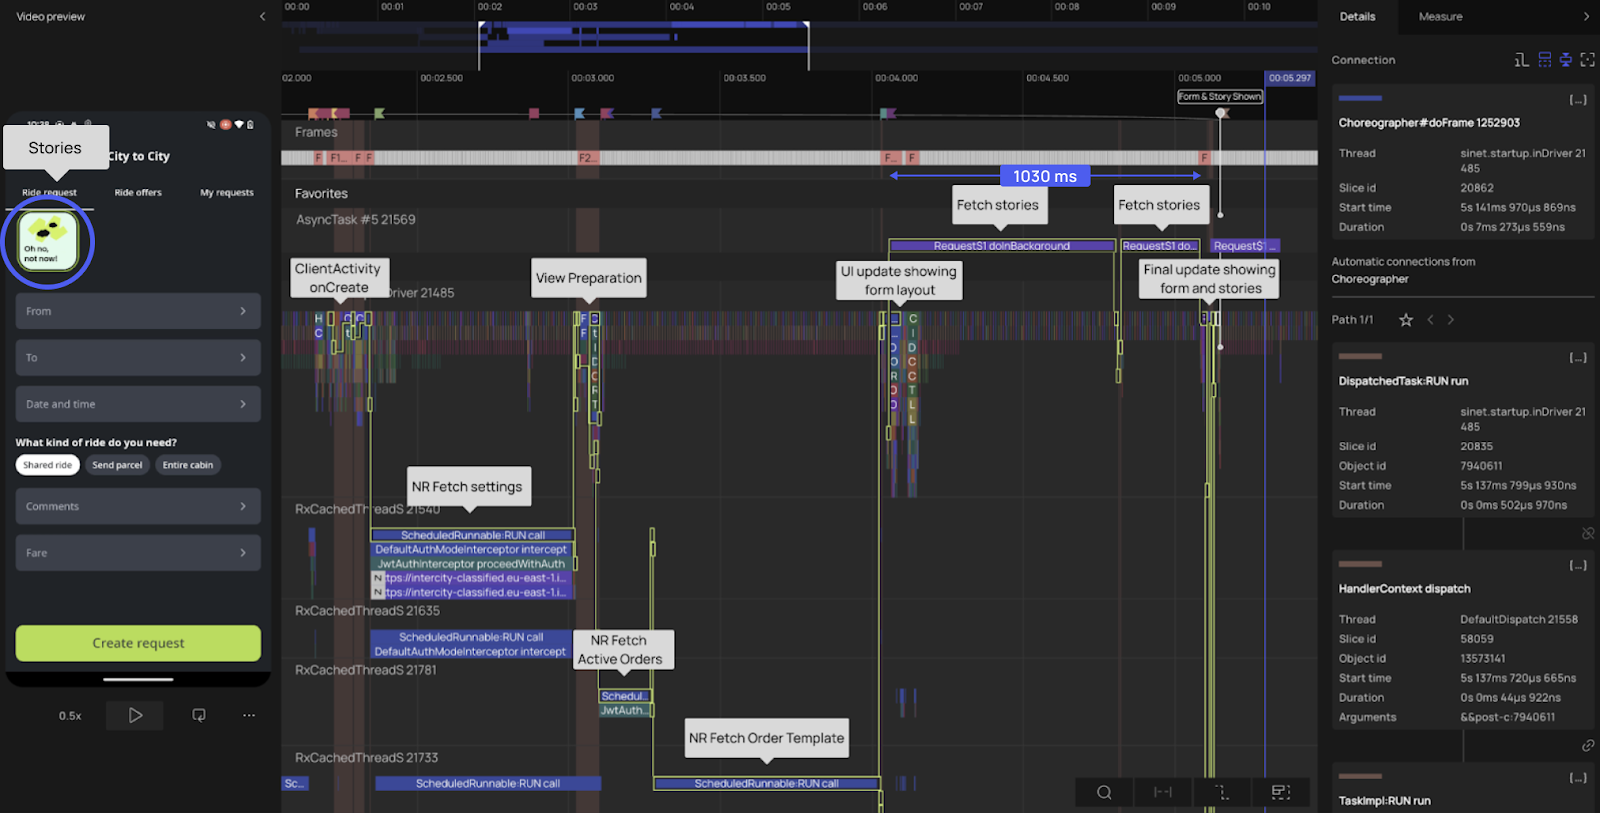
In both the City to City and Cargo flows, PS Tool showed that network requests critical to screen rendering and feature visibility were delayed unnecessarily. For example, in the City to City flow, story content was fetched only after final view preparation. Moving this request to the start of the lifecycle could reduce time to interactive by approximately 1,030 ms.
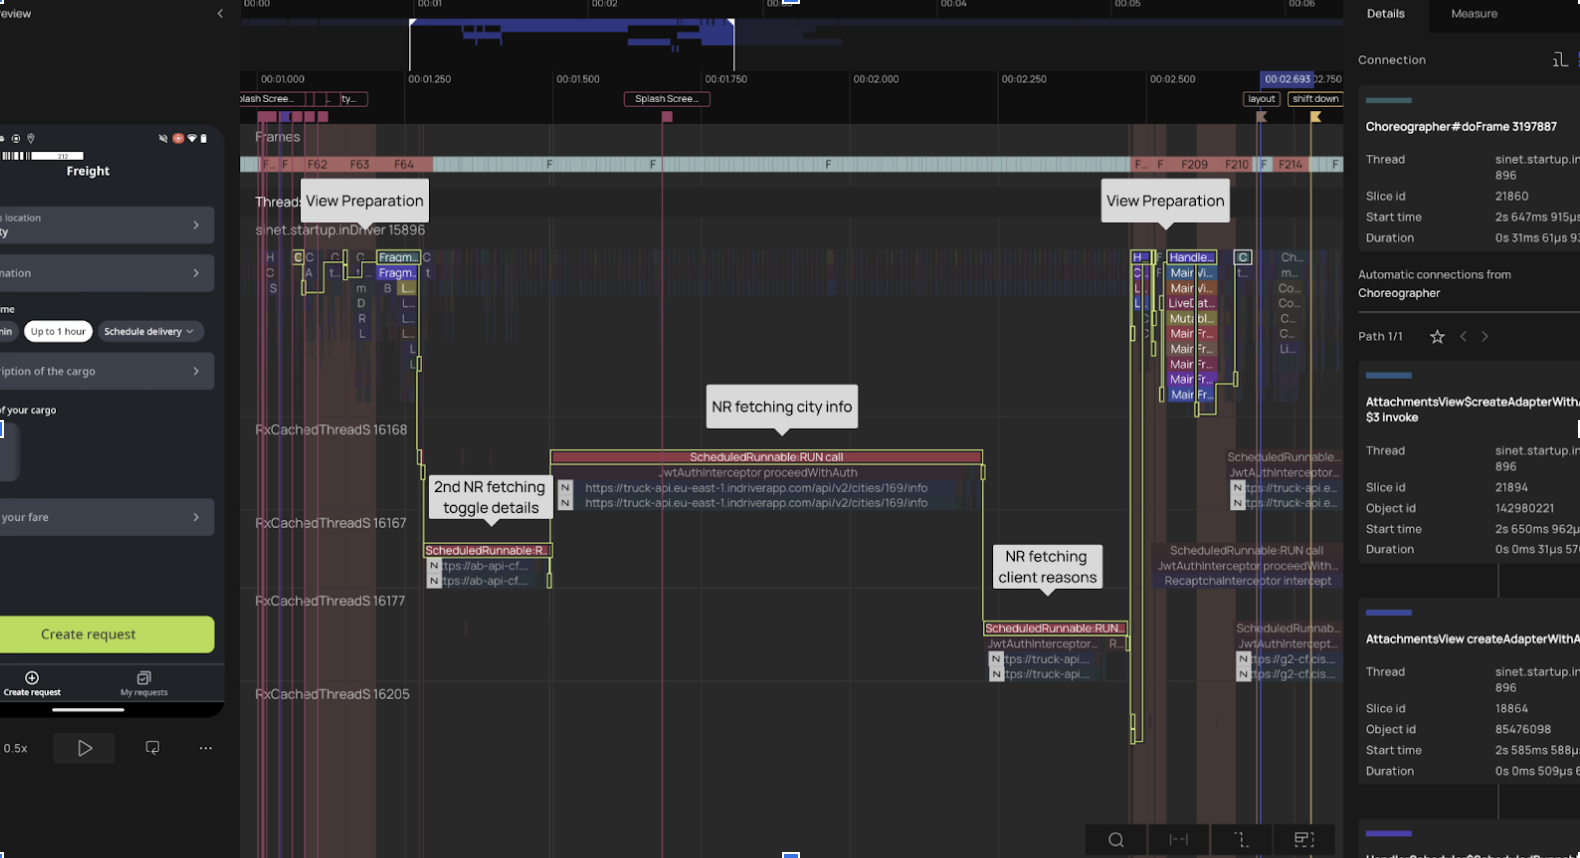
Similarly, the Cargo flow showed multiple network requests queued behind view initialization, creating unnecessary delay in presenting trip options. Rescheduling those requests to run from onCreate or another earlier lifecycle point could meaningfully reduce wait time.
Too Many Sequential Requests
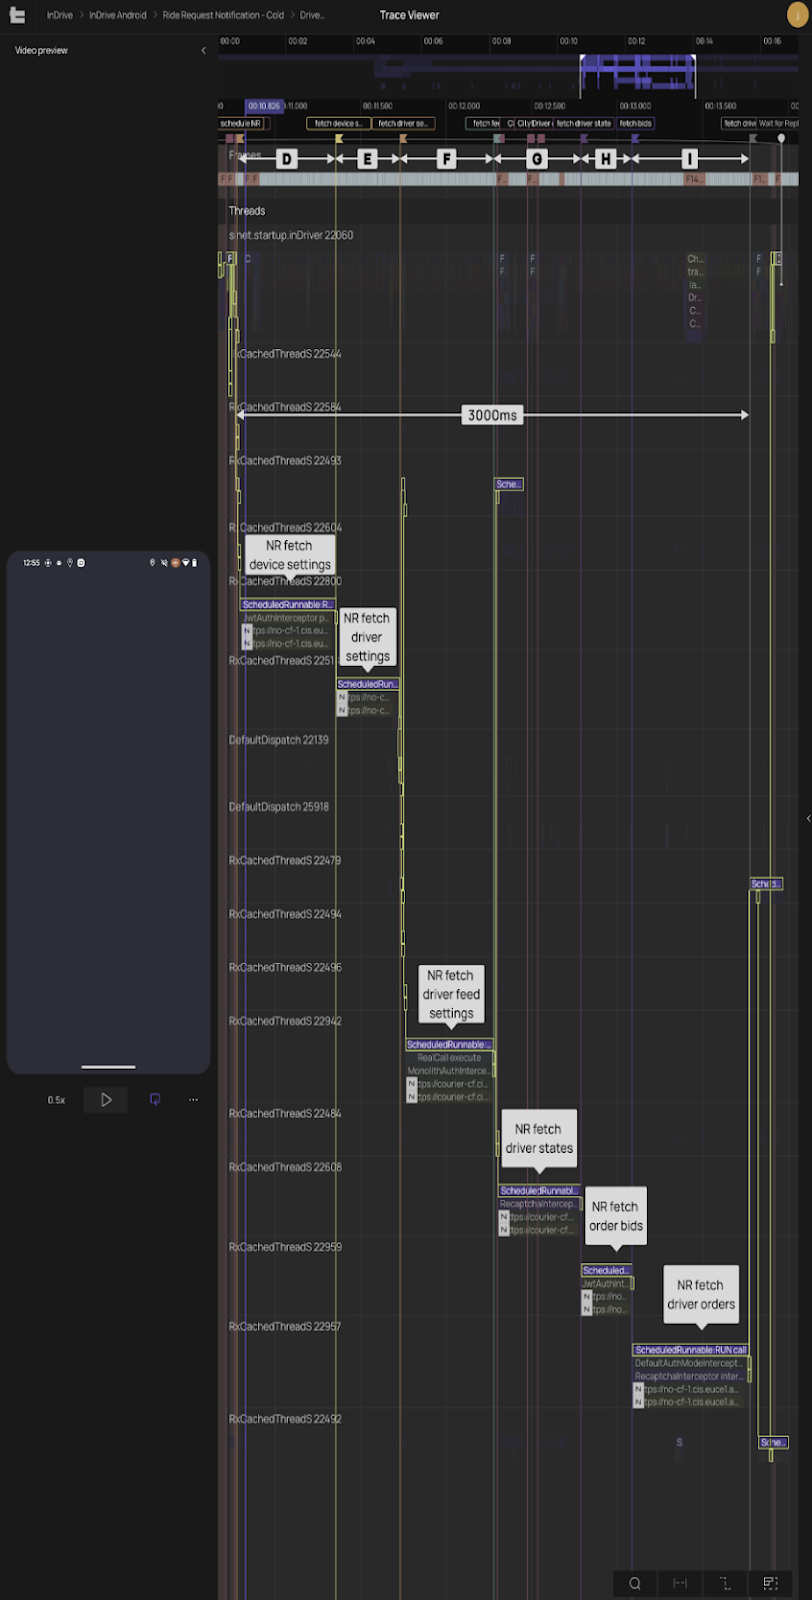
One of the most significant bottlenecks appeared in the Ride Request Notification flow, where six seemingly independent network requests were being executed one after another. These included map tile downloads, ride detail fetches, and device settings loads. By restructuring these to execute in parallel, ride information could be shown up to 2,358 ms faster, significantly improving driver response time.
Small Scheduling Changes That Add Up
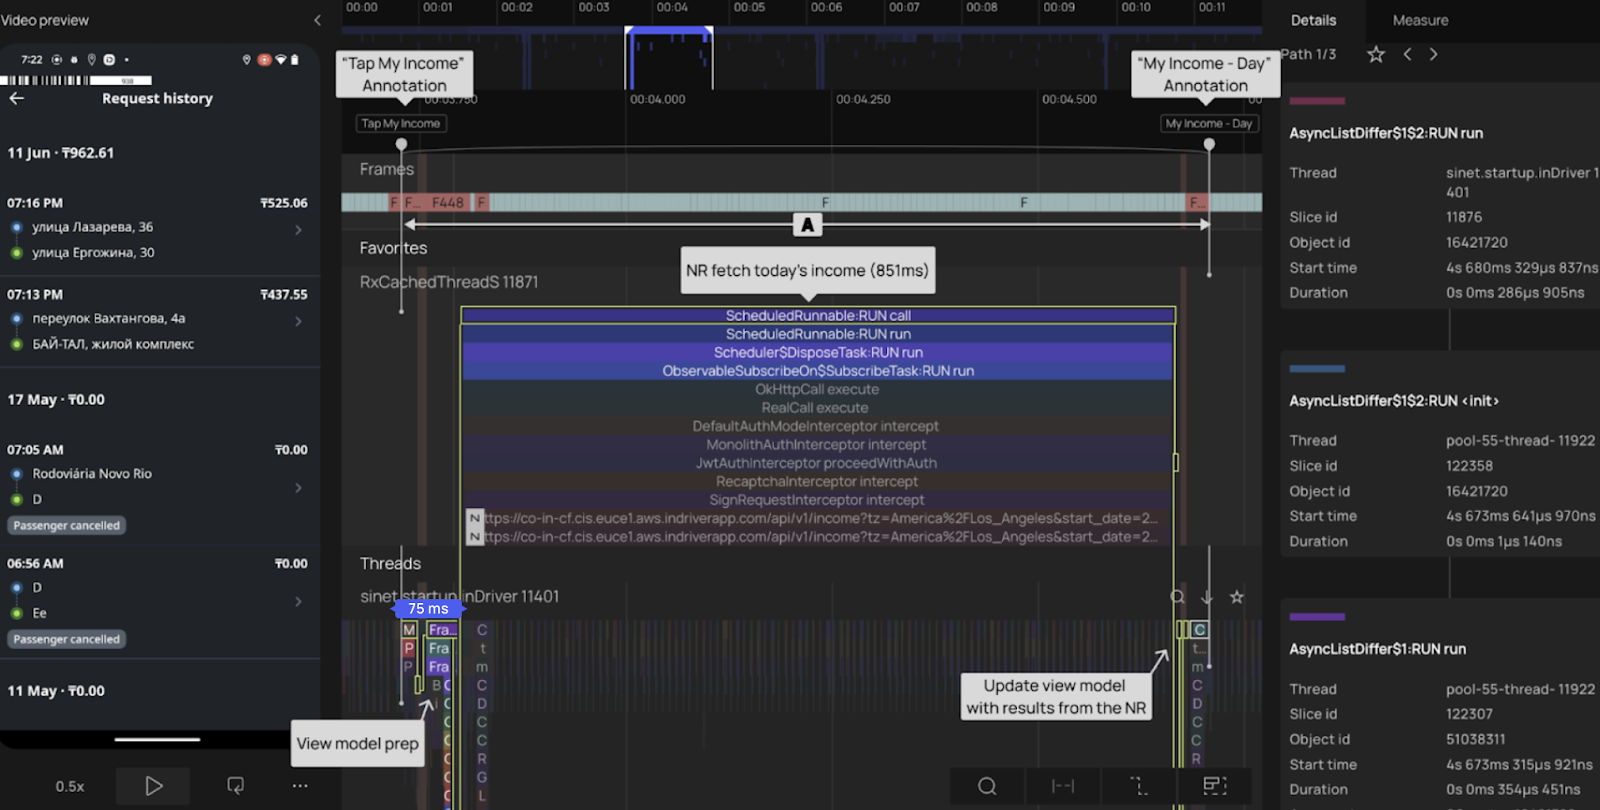
In other flows, more subtle but still valuable opportunities were uncovered. For example, in the My Income and Ride History screens, data fetching was delayed until after view rendering began. Triggering those requests as soon as the user tapped the button, rather than waiting for the screen to initialize, could save up to 75 ms per interaction.
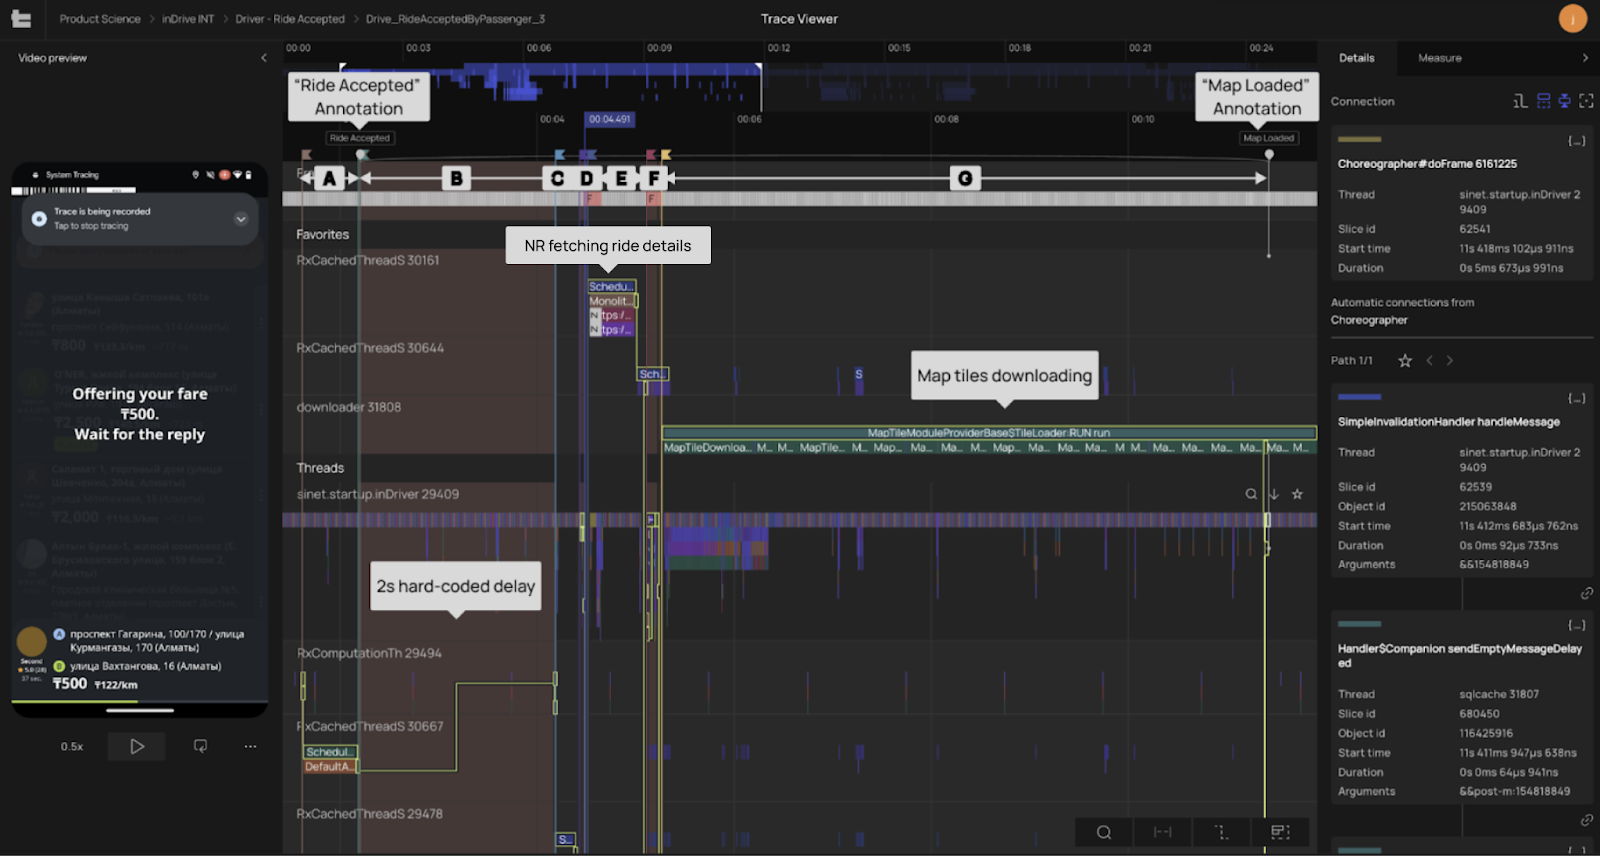
In the Accepted Ride flow, scheduling the request for ride details earlier, just after checking bid status, could reduce loading time by up to 115 ms. Another 155 ms could be saved by dedicating more threads to map tile decoding. These small shifts are easy to implement but deliver noticeable improvements.
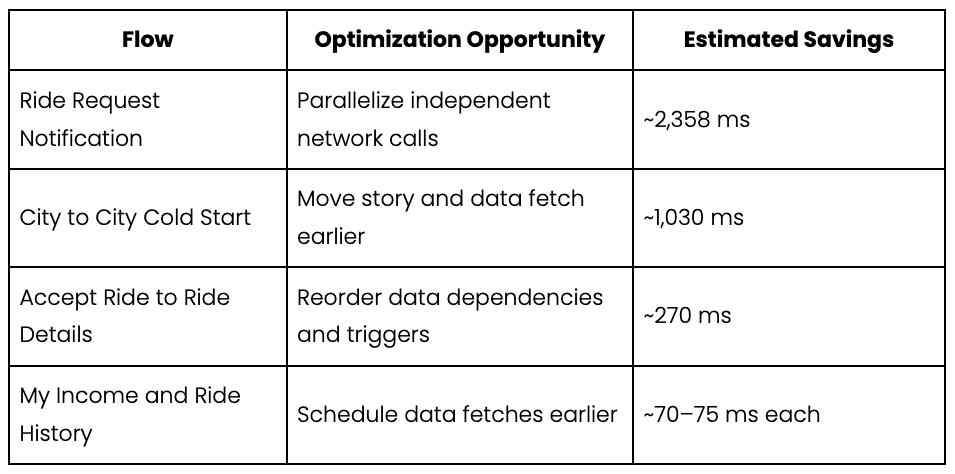
Snapshot of Potential Gains
This Matters for inDrive’s Bottom Line
Optimizing mobile performance is not just about cleaner code. It is a direct path to measurable business value. The latency savings found with PS Tool align with four major areas of impact:
- Better Retention: Users are more likely to return to a responsive app. Even small delays can lead to drop-off, especially for users in high-urgency situations like hailing a ride.
- More Rides Completed: Reducing load time in flows like Ride Request Notification helps drivers respond faster, leading to more completed rides and greater driver earnings.
- Lower Infrastructure Costs: Smarter request scheduling and fewer retries help reduce the load on backend systems, saving on compute resources and operational overhead.
- Brand Advantage: A faster app differentiates inDrive from competitors. It strengthens the perception of quality and builds user trust over time.
What’s Next
With these insights in hand, inDrive can:
- Prioritize fixes in high-impact flows like Ride Request Notification and City to City
- Apply similar scheduling optimizations across adjacent flows
- Use instrumentation to validate production gains and monitor performance over time
- Embed trace review into future release QA cycles using PS Tool
The Takeaway
Over just eight weeks, inDrive leveraged PS Tool to surface more than 4.5 seconds in cumulative latency savings across a select group of everyday flows. Addressing these insights does not require refactoring or risky architectural changes. Instead, they show how targeted, trace-informed scheduling improvements can transform the user experience and boost overall efficiency.
If your team is ready to find hidden performance wins without a full rebuild, Product Science and PS Tool is here to help.