Pinterest has always focused first and foremost on user experience. With 450 million active users, more creator content is coming to Pinterest. Important content distribution timeliness are more challenging every day. To achieve great experiences that empower Creators to get paid for inspiring content, while also helping Pinners with more ways to watch, make and shop creator ideas, performance improvements are an even more integral part of Pinterest’s development process.
Pinterest’s home feed holds strong user experience and performance significance. As soon as the app starts, Pinners begin their journey to “watch” or “browse” inspirations which ultimately impacts Creator’s success. It is critical for Pinterest to ensure fresh Pins are surfaced to Pinners, and Creators get more impression and engagements for their content.
In this article, we’ll present an example for how to use PS Tool to gain actionable insights to optimize rich content loading efficiency for user flows that are critical to business (like Pinterest’s home feed). And we’ll cover how you can get started with Product Science.
The Cost and Opportunities of a 132ms (Ads Delivery) Delay
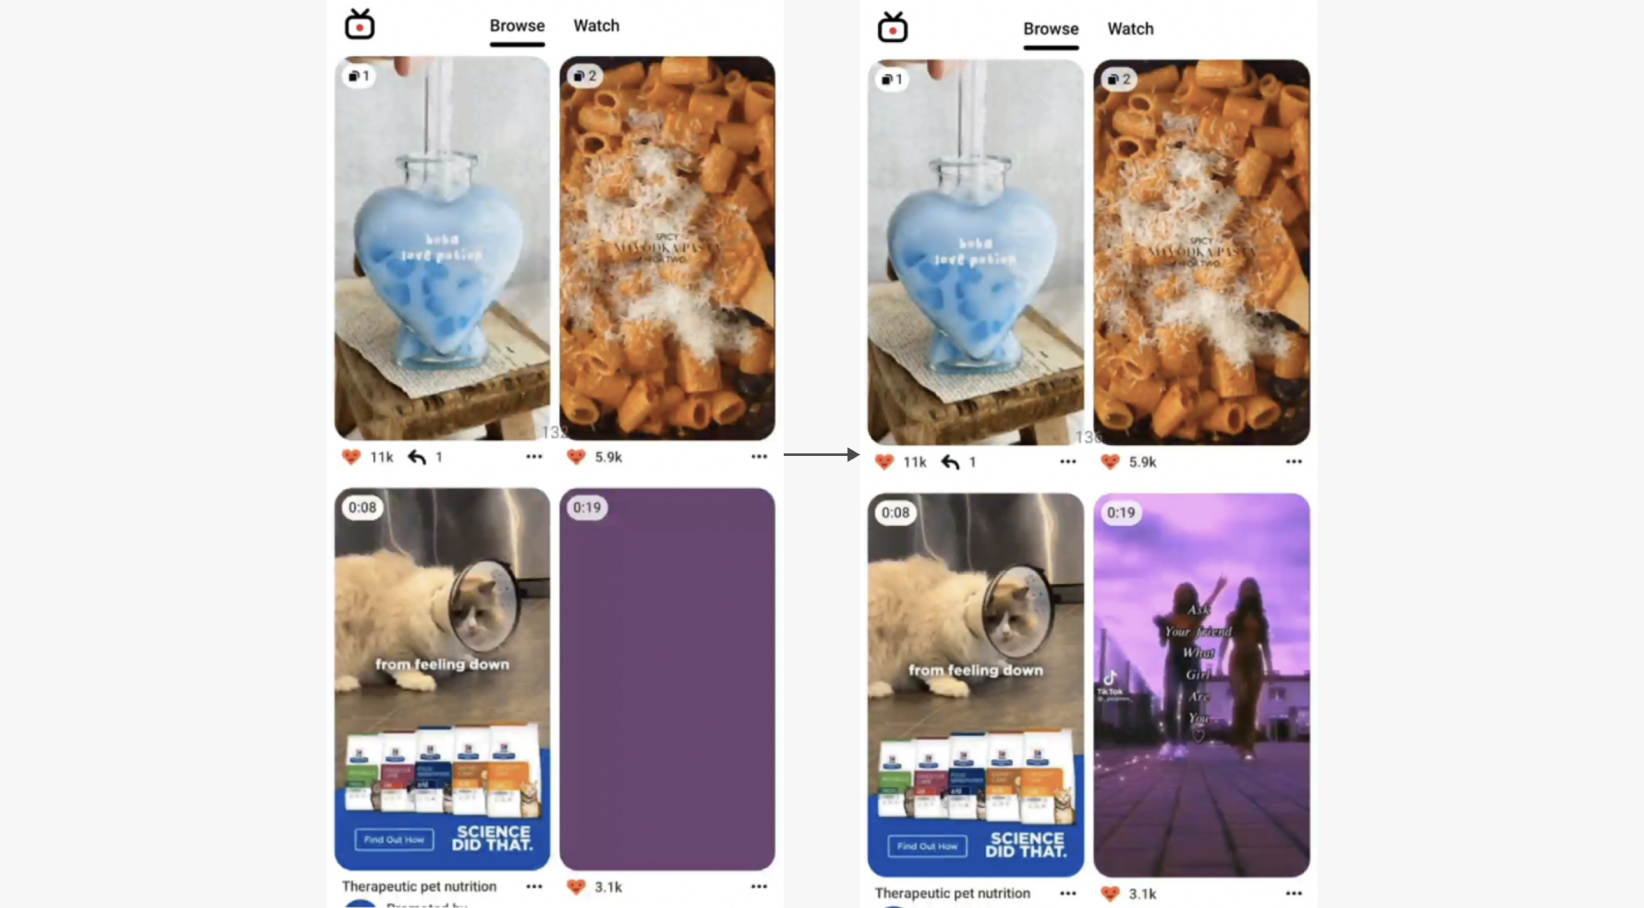
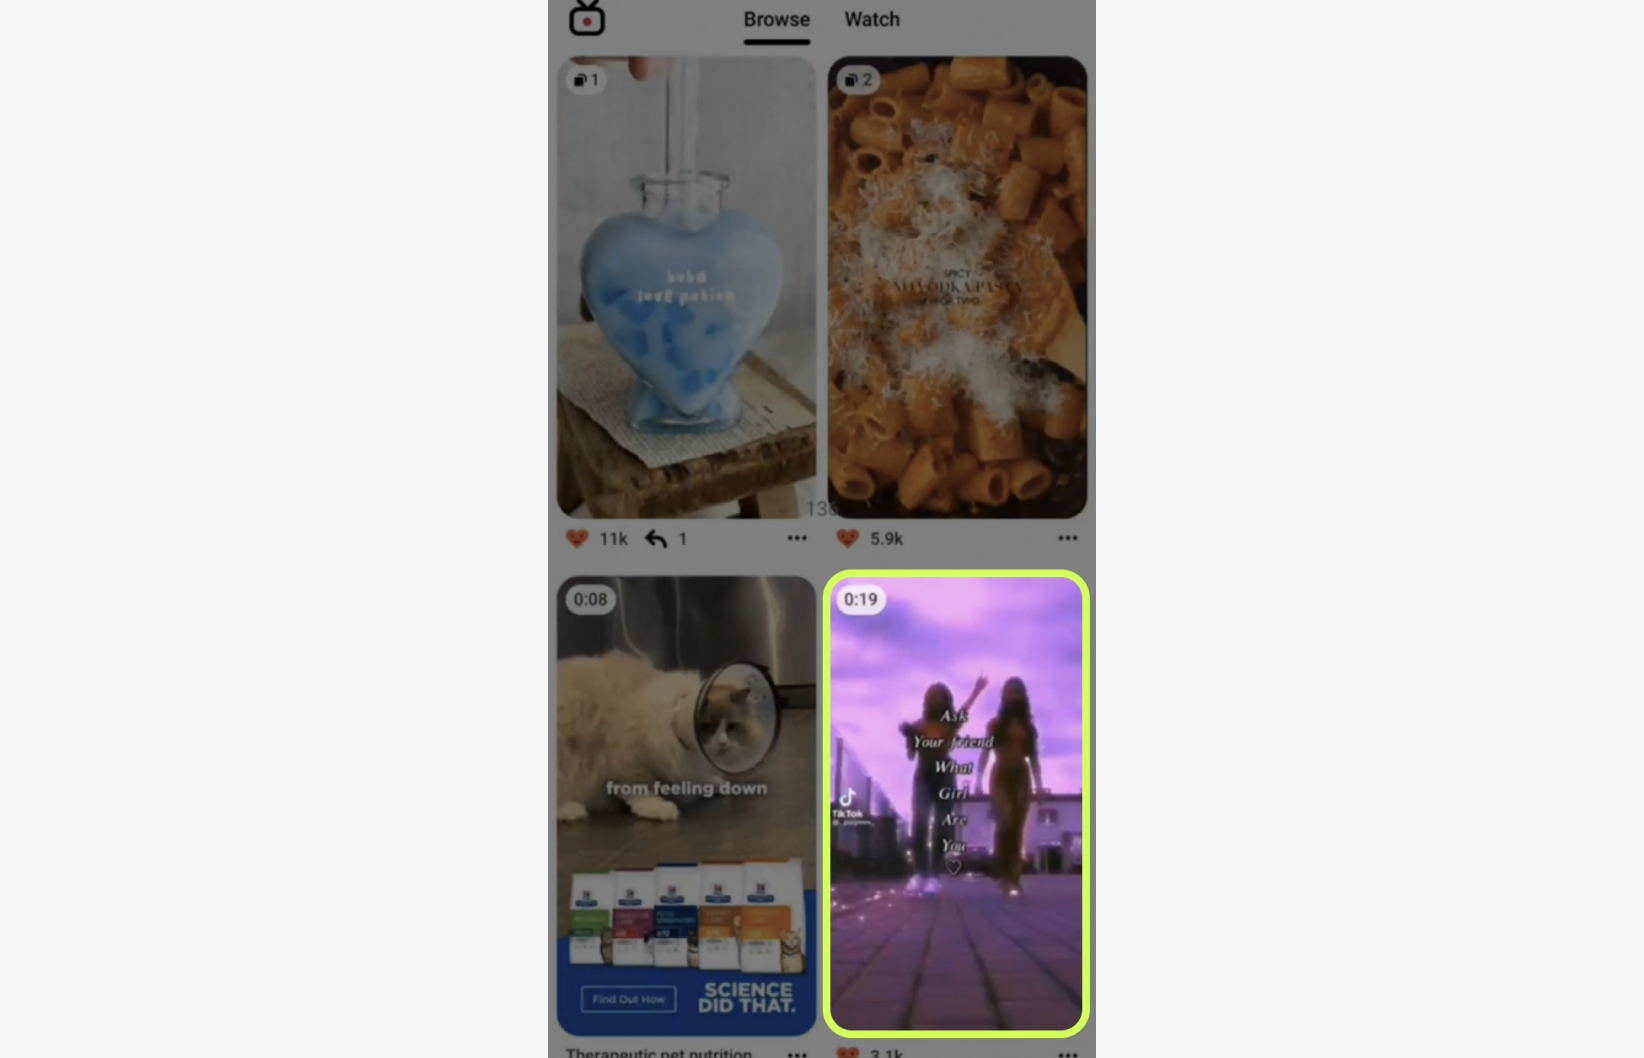
Take a look at the example below and you'll notice that the bottom right pin on Pinterest's home feed takes an additional 132ms to load compared to the other three pins. By using PS Tool's video-trace synchronization feature, we were able to confirm that the first three pins were loaded by Frame #123, while the fourth pin didn't appear on the screen until Frame #133.
Pinterest's visually-driven platform provides an engaging user experience, but the presence of black screens can hinder this experience, leading to decreased exposure for creators and less effective ad spending for advertisers. Ads that do not provide useful information are less likely to capture users' attention, resulting in fewer clicks and conversions.
Pinterest's ad-serving platform generates over $2.5 billion in ad spend per year, and as a result, the company invests heavily in delivering relevant ads that resonate with Pinners based on their interests, intent, and engagement on the platform. The goal is to ensure that advertisers are able to make the most of their ad campaign budgets and achieve their desired conversions. It is less than ideal that sub-optimalities in the app's code that are invisible without the PS Tool can prevent ads from being delivered, which is a significant setback. It’s crucial to address this issue as advertisers may cut back on their spending during an economic downturn, which could adversely affect Pinterest's revenue growth, currently at an impressive 8.71% year-over-year.
The delayed loading of the fourth pin indicates that there is room to help creators or advertisers generate more conversions or sales on Pinterest.
Sequential processing:a common rich content loading problem
Looking at the execution path—a Product Science technology that lets your backtrack the sequence of functions executed—you can see from the Choreographer slice associated with video frame #133, there is a loading queue in Thread 16322 to load the pins on the screen. (See the yellow path below).
.png)
To better understand the loading queue, click on the slice to review the URL of the image or video.
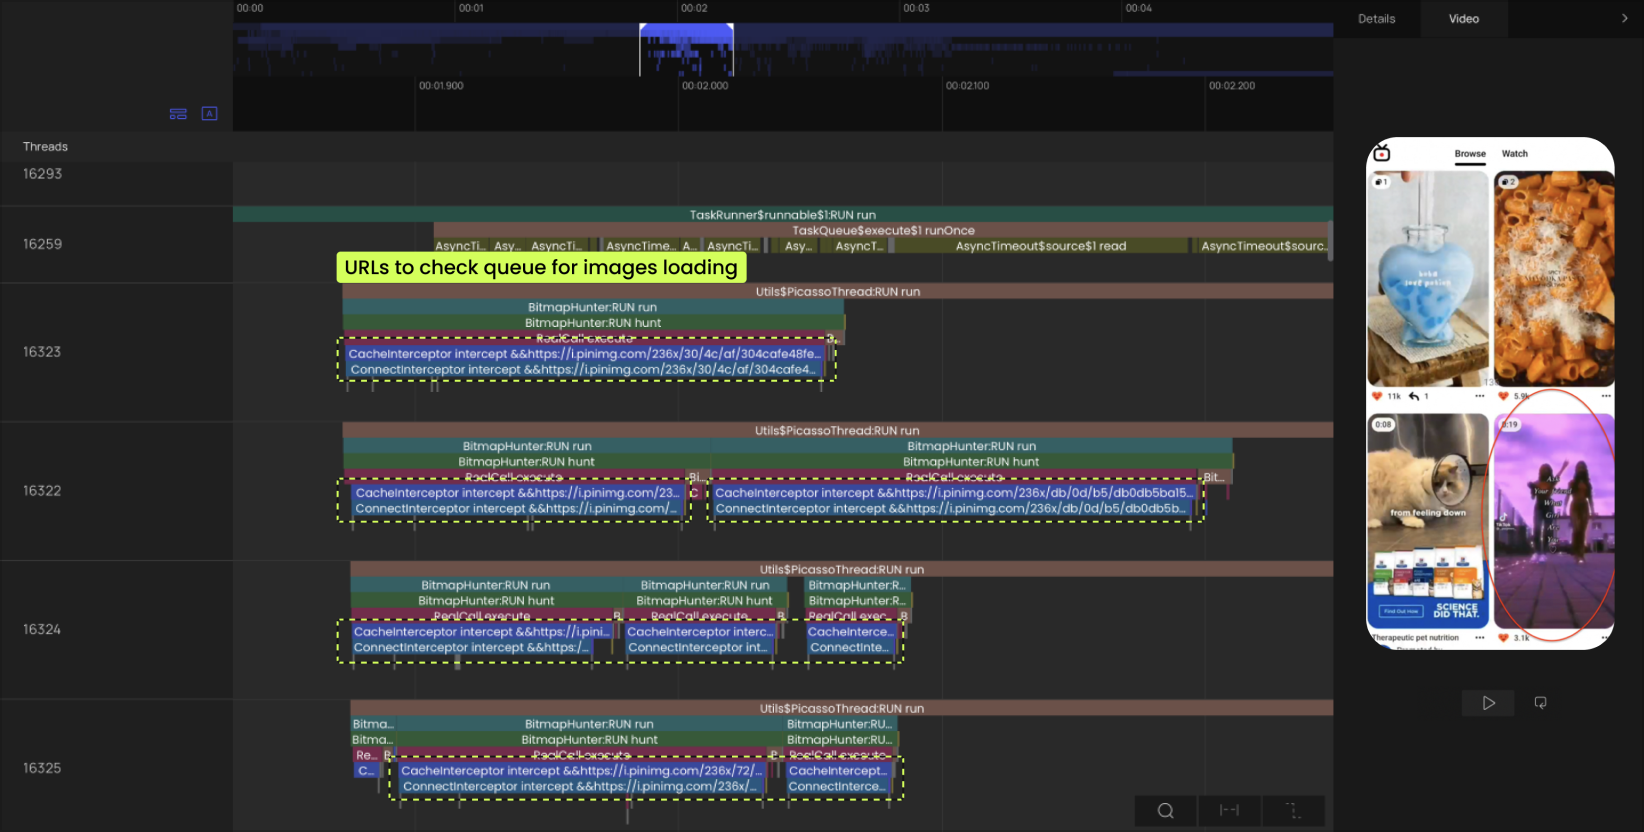
Following the URLs, we can see that Pin 1 and Pin 4 from the home feed are in the queue in Thread 16322.
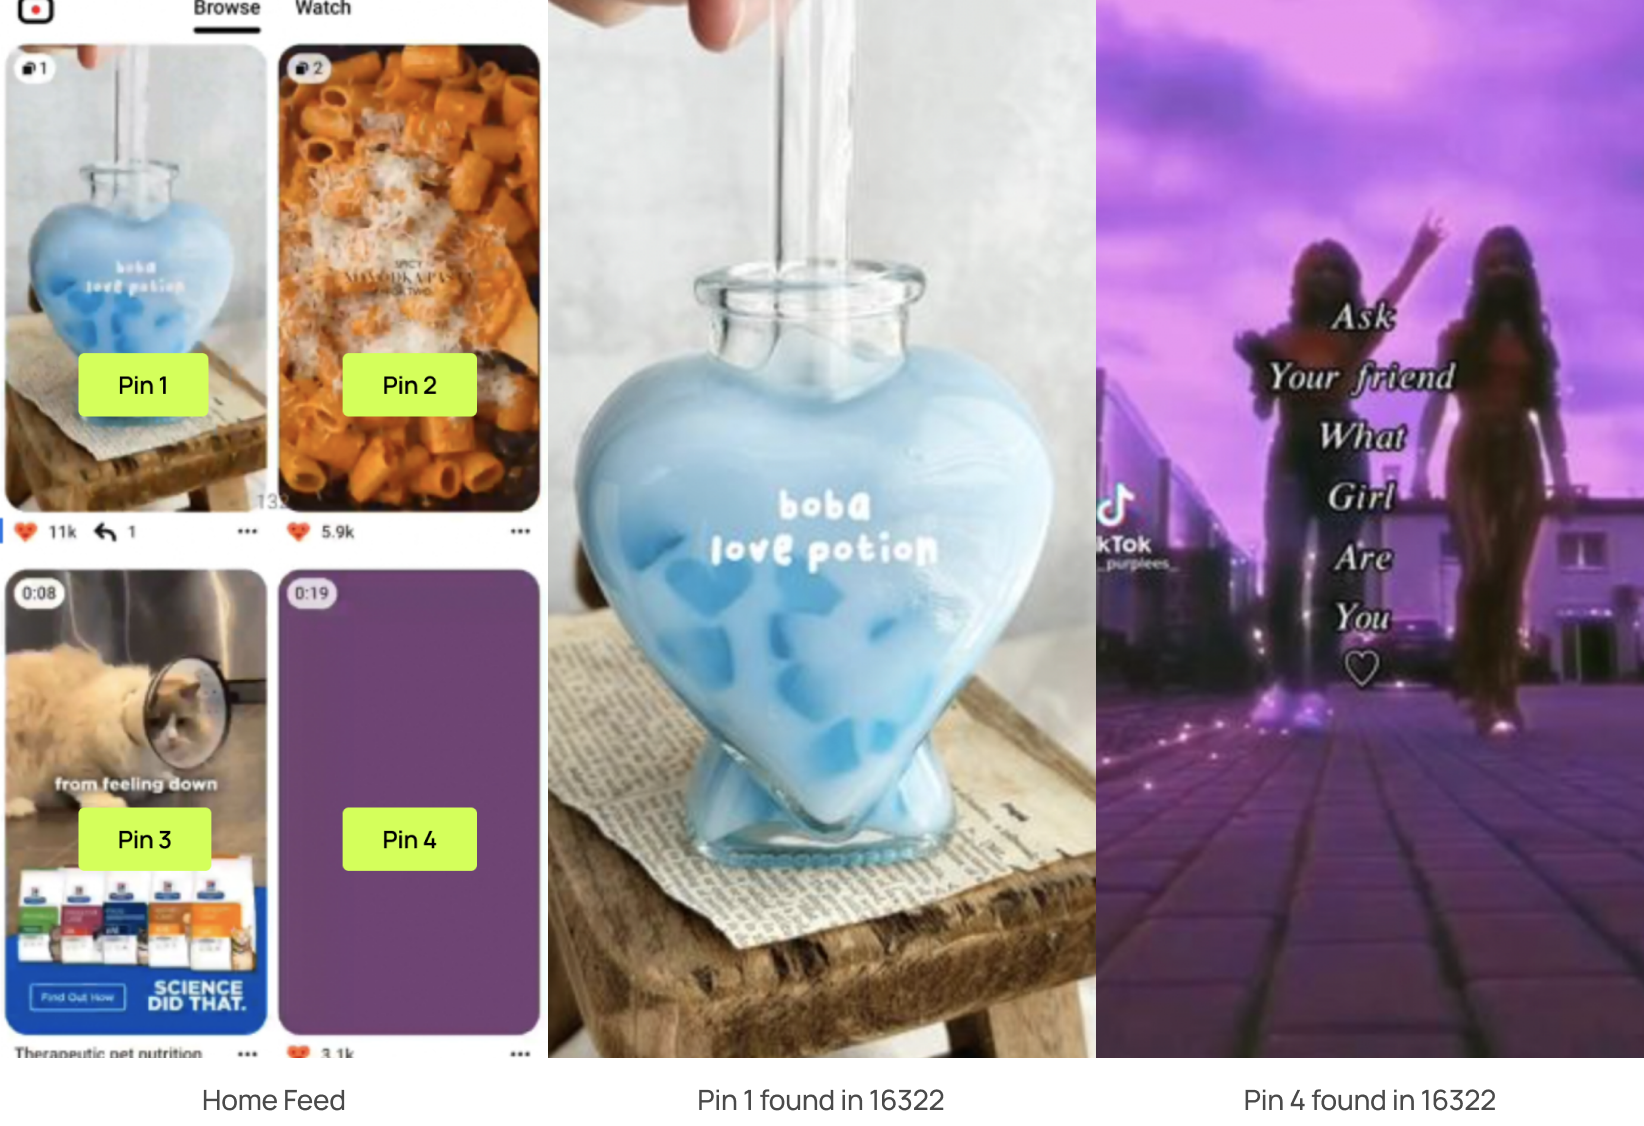
The parallel threads (#16322 and 16323) reveal that Pin 1 and Pin 4 are being loaded sequentially, rather than in parallel, because there are other pins taking up the pool of four dedicated threads.
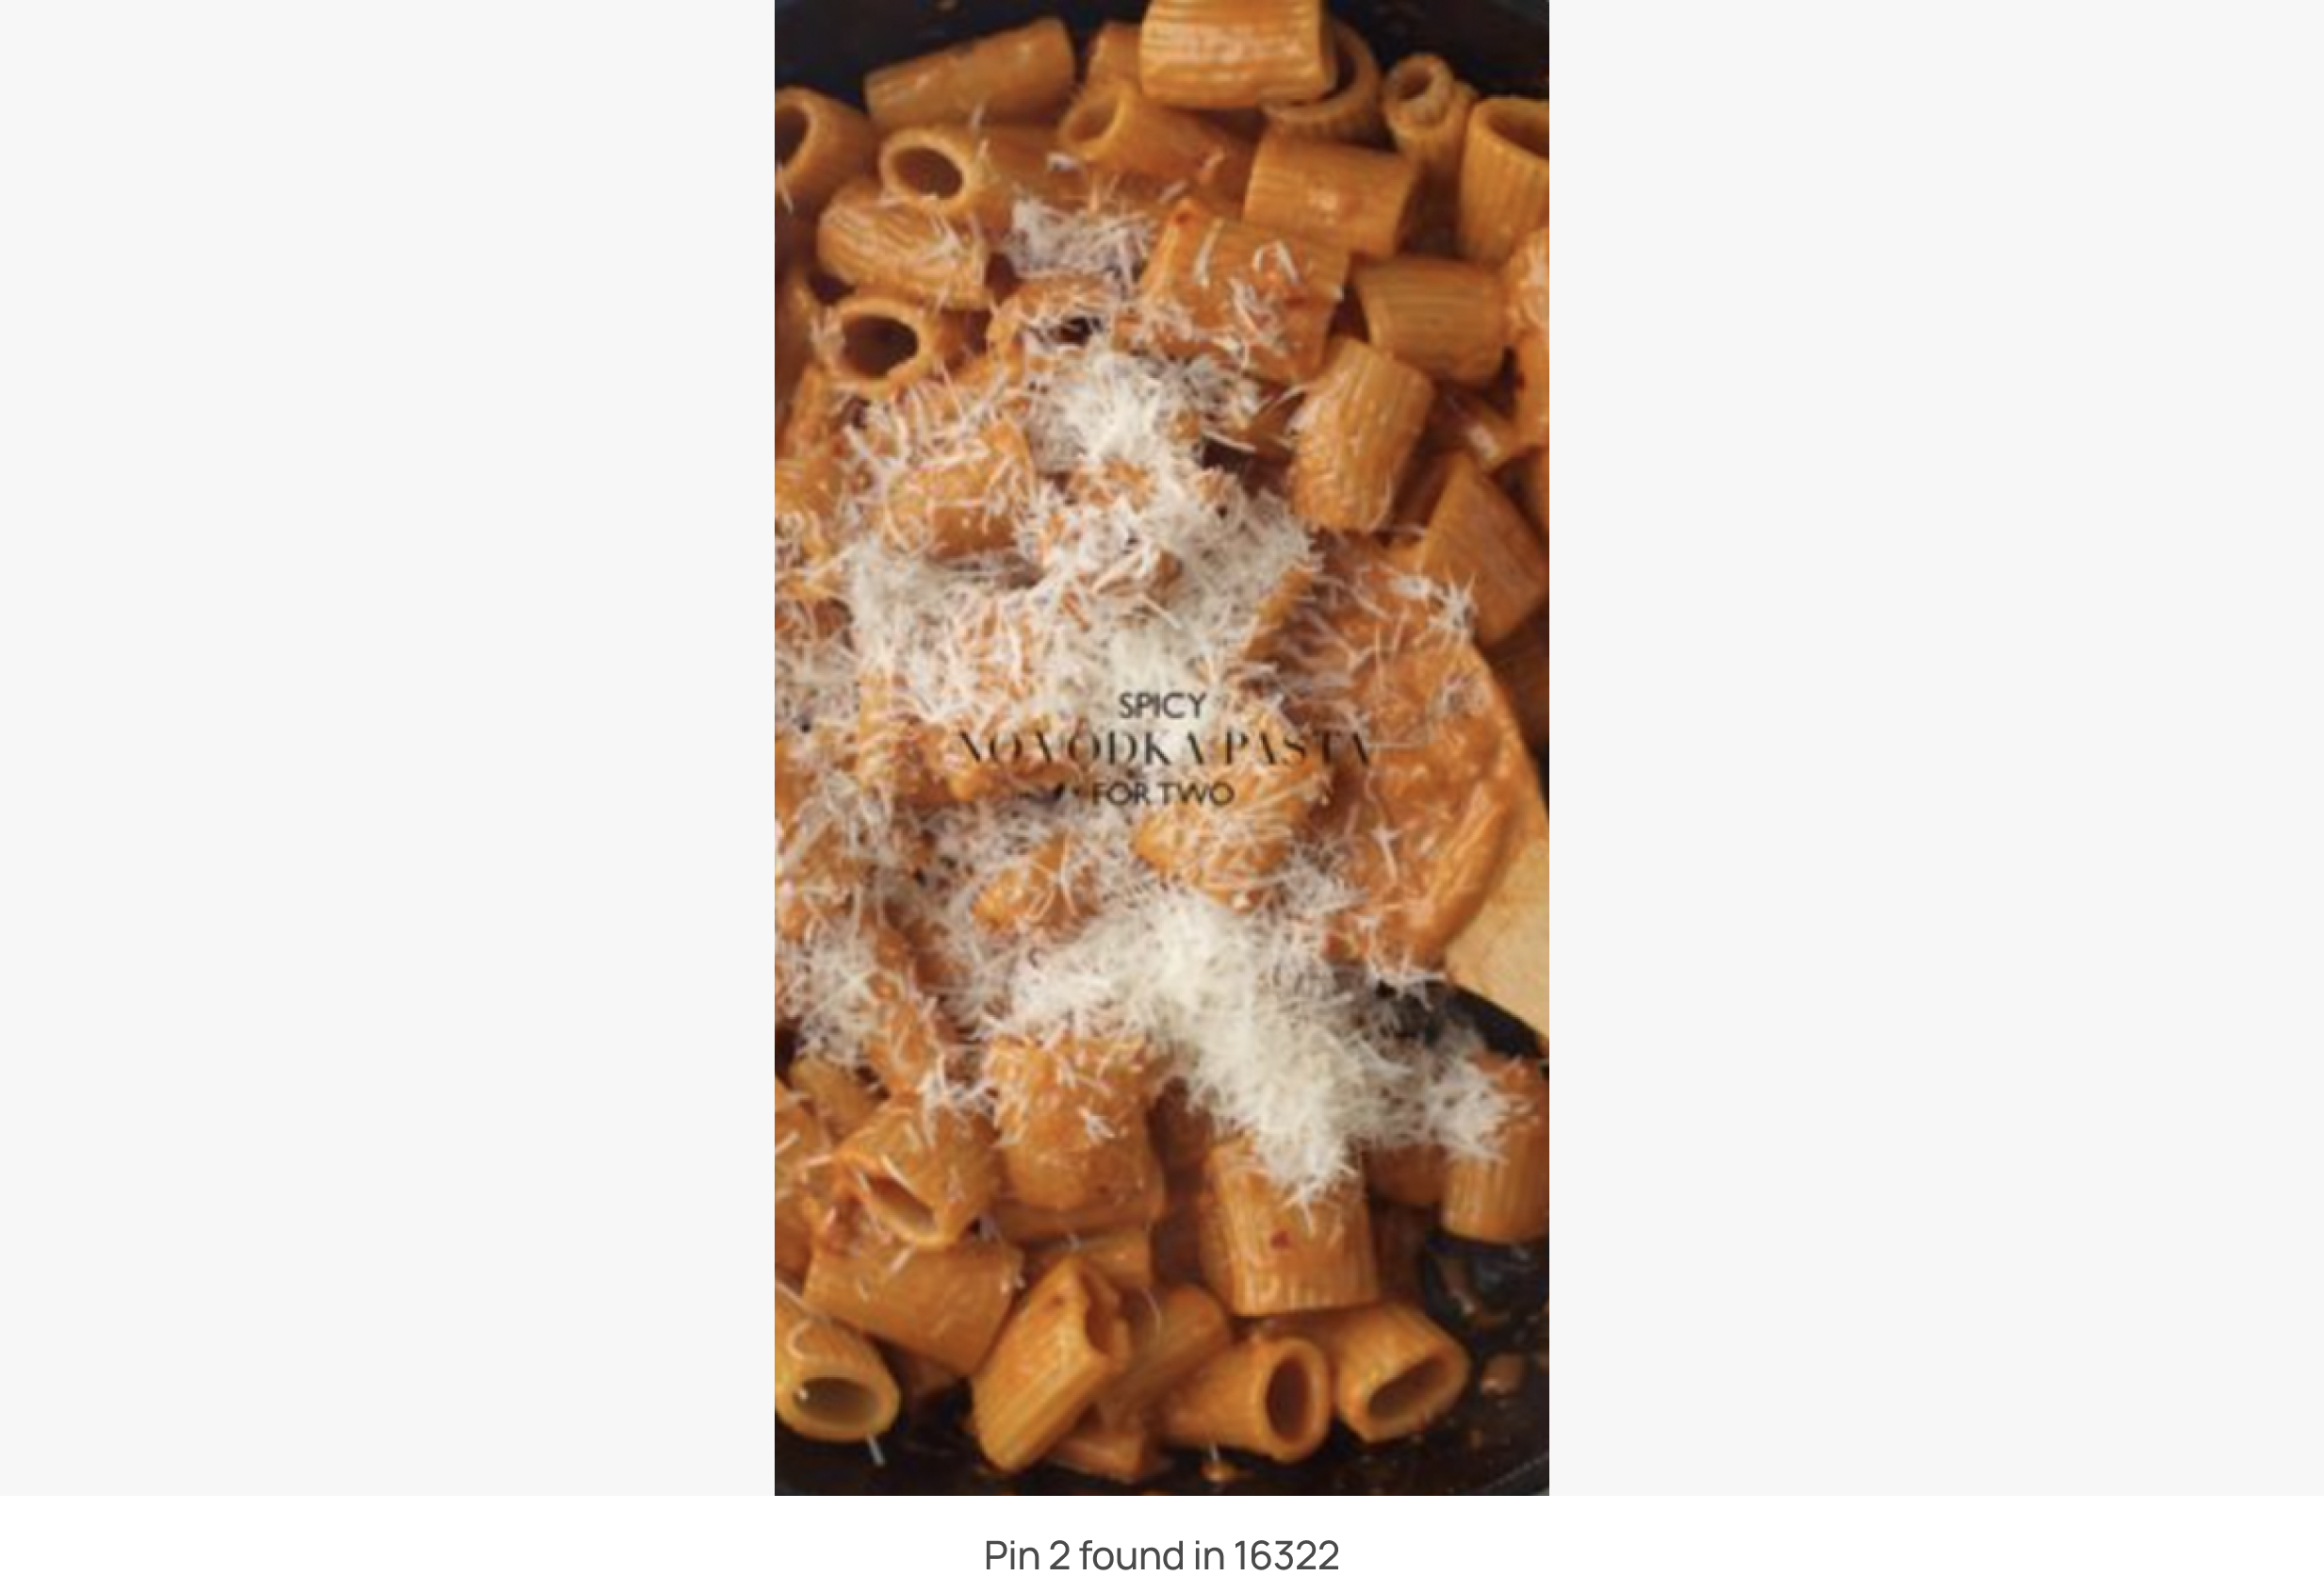
When prioritized appropriately, the first images to be shown on the home feed should be processed concurrently. Pin 2 that was loaded in Thread 16323 was a good example of concurrent processing to maximize content distribution efficiency without delays.
When prioritized appropriately, the first images to be shown on the home feed should be processed concurrently. Pin 2 that was loaded in Thread 16323 was a good example of concurrent processing to maximize content distribution efficiency without delays.
And when we followed the URLs for Thread 16324, we found that pins shown later in the feed were being prioritized ahead of other pins, such as Pin 4, that should be displayed with no delay.

The same for Thread 16325—some pins are shown later in the feed but were prioritized before Pin 4. Only the cat video is initially shown in the feed.

With PS Tool's video-trace synchronization feature, we identified some pins being deprioritized later in the feed when they have higher business and user experience priorities to Pinterest’s app start. This indicated an opportunity for performance optimization, where we could reevaluate the logic for pin image loading and attempt to process home feed pins first in parallel threads. Reprioritizing the loading of home feed pins could potentially save up to 140ms, ultimately reducing the time it took for the fourth pin to display on the UI.
While analyzing the cause for Pin 4’s delay, another interesting insight that could’ve saved another 180ms revealed itself in PS Tool.
All video Pins on Pinterest begin with a video cover or image. When the right circumstances converge, Pinners and Creators can barely notice this image since videos start playing as soon as they’re fetched. The whole purpose of the image for a video Pin is to buy the system some time to download and show the video ASAP in the UI. However, in the example above, we noticed a delay before the Video pin played automatically. Using the video synchronization and execution path features again, we saw that the video loading started ~180ms later than the image loading. This delay occurs because the task that initiates the video loading is called by the Choreographer, which updates the view, instead of being called by the network request that fetches the feed.
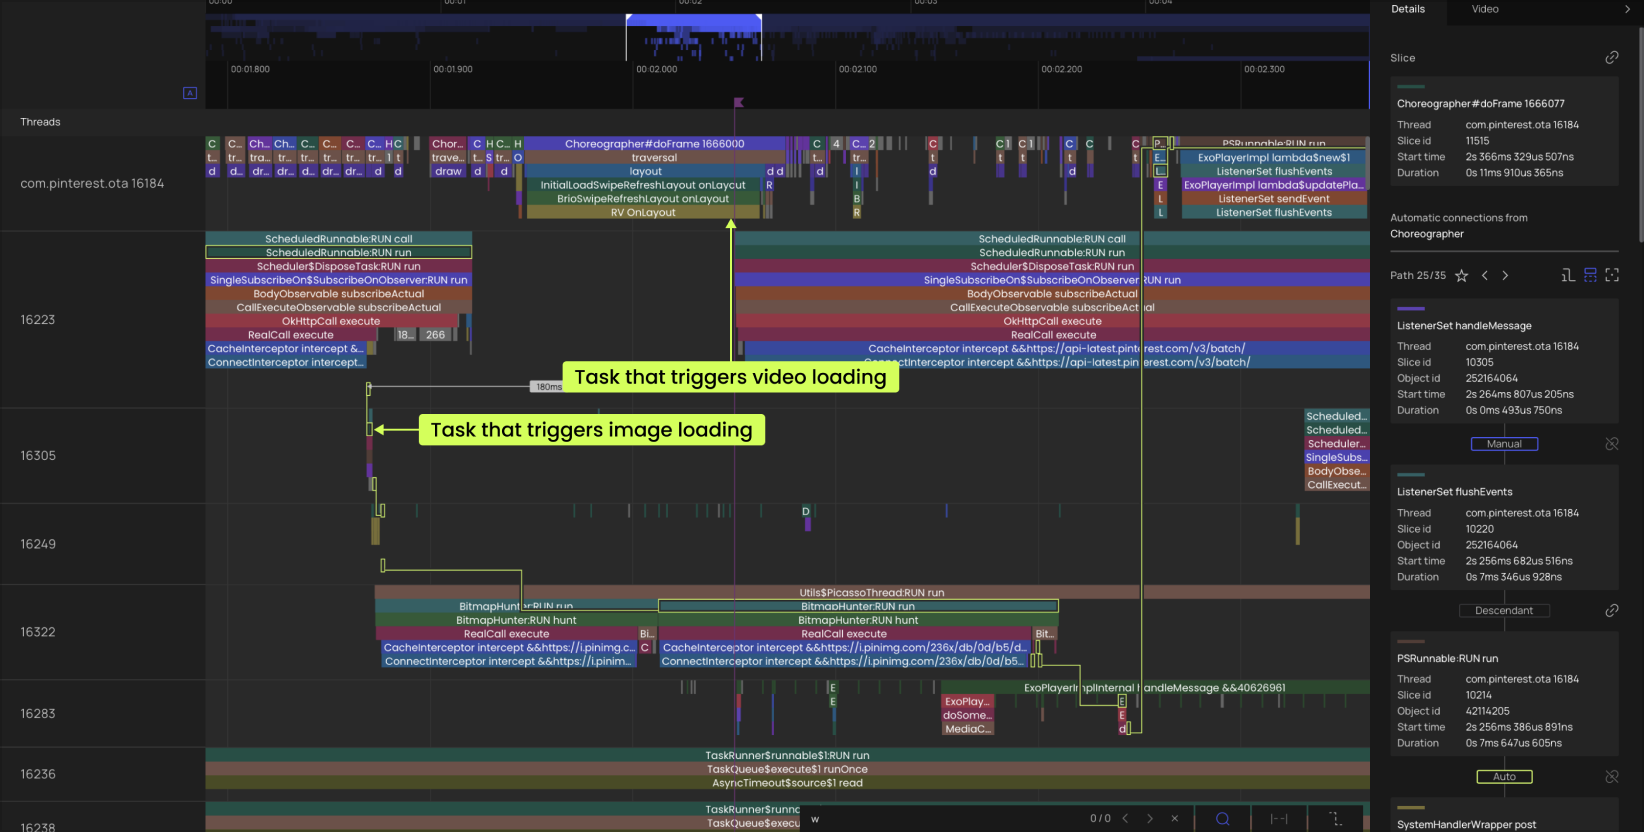
To optimize the Video pin loading, the task that initiated the video loading should’ve been called from the network request that fetched the feed, like the pin image loading task was, rather than being called from the Choreographer that updated the view after the feed was fetched. This allowed the video loading to start ~180ms earlier.
But that’s not it! With PS Tool, we identified a third insight around ExoPlayer that could’ve potentially been an additional ~100ms for Pinterest’s app start. This will be covered in detail in a future case study. If you’d like to learn more about ExoPlayer and other open source libraries common efficiencies, follow us on LinkedIn and stay tuned!
By adding all the insights together, the PS Tool saved a total of ~420ms (~17.5% of the total time) for Pinterests’ app start!
Best Practices for Performance Optimization
There are many different ways to identify performance optimization opportunities. They can come from direct customer feedback, personal experience, alerts from monitoring tools or witnessing a significant drop in important business metrics, etc. At Product Science, we believe performance optimization begins with identifying important user flows that matter to your business. These user flows should be prioritized for iteration and improvement.
Here’s our recommendation on approaching mobile performance optimization:
- Identify a user flow
A “user flow” refers to when a user performs an action and the app provides a response. This should be something that is important to your business. For example, you have a photo taking app. You would probably want to make sure when your user taps the “take a picture” button the camera opens immediately. - Close all your apps
- Start screen recording
- Start tracing
- Walk through user flows
(i.e. perform the user action and wait until the app provide a response to record the complete user flow) - Upload video and trace to profiler or visualization tools
- Analyze trace
- Locate delay and identify cause
- Update your code
Industry leading benefits of PS Tool
The PS Tool stands out in the performance market and shines where it matter most:
- No manual instrumentation
Not only does this help save time, the AI technology ensures that developers are instrumenting the right libraries and functions they may not normally consider. - Video synchronization
This first to market feature empowers developers to instantly connect user experience back to the code. Instead of digging through piles of code, developers simply identify delays from the screen recording and use the time indicator to locate the associated code instead. - Execution path
PS Tool helps developers backtrack what happened to users in real life by showing the sequence of functions that went from point A (the user action) to point B (the app response).
Product Science is driven to empower app developers to optimize performance seamlessly and efficiently. There are many other features that weren’t covered in this article, but if you’d like to learn more about how you and your team can start leveraging PS Tool and reduce your app start time or other user flow by 6% or higher like Pinterest, send a message and learn more about how we are revolutionizing the way developers work.